

A guide to understanding the web-based interface for monitoring and managing client-level operations on the Quepass platform. The Client Dashboard serves as the centralized control panel for clients to monitor system performance, transaction activity, licensing status, and operational health within their own environment. It provides real-time visibility into usage metrics, customer activity, and system components relevant to the logged-in client. You can access the Client Dashboard by visiting:Documentation Index
Fetch the complete documentation index at: https://docs.quepass.com/llms.txt
Use this file to discover all available pages before exploring further.
https://dashboard.quepass.com
1. Dashboard UI
The Home section provides a consolidated overview of analytics, activity insights, and system monitoring tools tailored to the logged-in client.2. Using the Dashboard
The Client Dashboard functions as a monitoring and operational management layer for client users.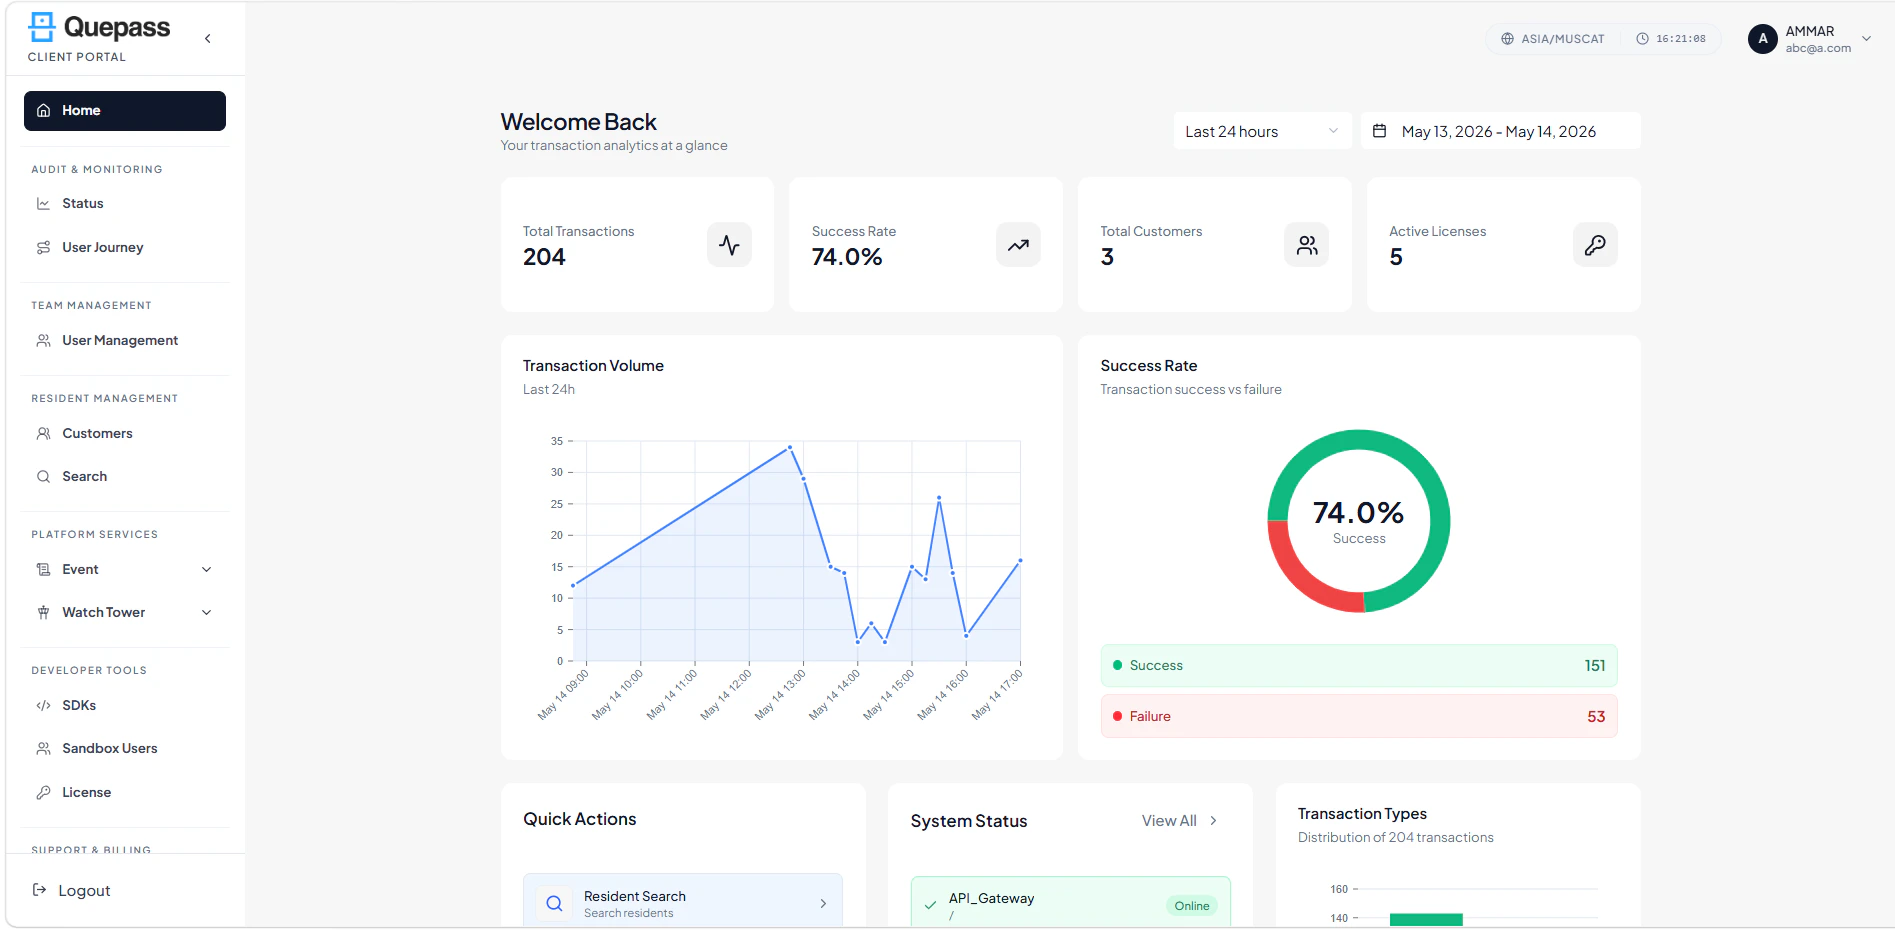
Dashboard Header & Time Filters
The header section displays:- Dashboard title and overview description
- Time range filter (e.g., Last 24 Hours)
- Custom date selection option

Monitor Platform Performance
The top section provides key performance indicators (KPIs), including: Total Transactions — Total number of transactions processed for the logged-in client within the selected time range Success Rate — Percentage of successful transactions Total Customers — Number of registered users associated with the client Active Licenses — Number of licenses currently active
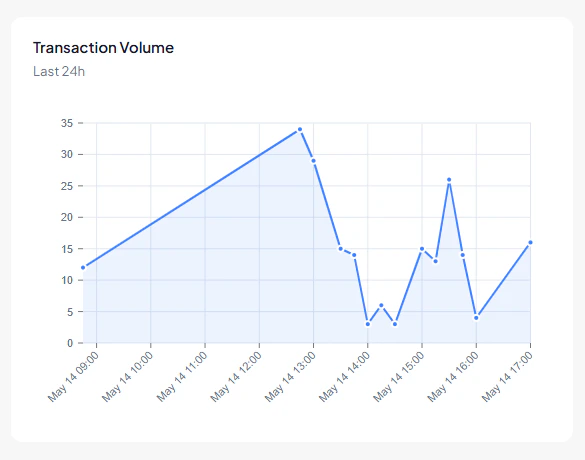
Analyze Transaction Trends
Transaction Volume
A line graph visualizes transaction activity over time. This enables clients to:- Identify usage trends
- Detect peak activity periods
- Spot potential anomalies
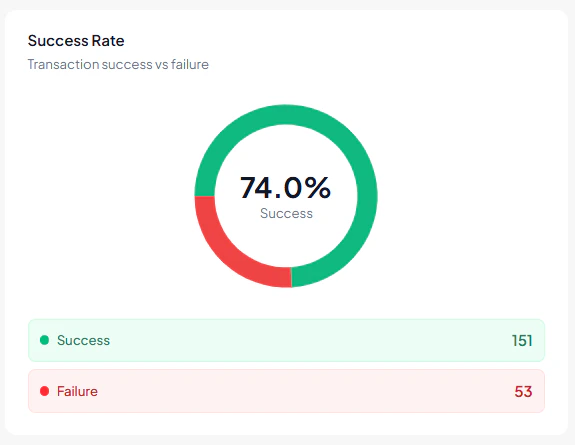
Success Rate Analysis
A donut chart provides a breakdown of:- Overall success percentage
- Total successful transactions
- Total failed transactions
Perform Quick Administrative Actions
The Quick Actions panel provides shortcuts to commonly used features:- Resident Search
- Customer Management
- Generate License
- Add Clients

Monitor System Health/ Status
The System Status section provides real-time monitoring of core components:- API Gateway
- Client Dashboard
- Admin Dashboard
- SDK
- Search Engine

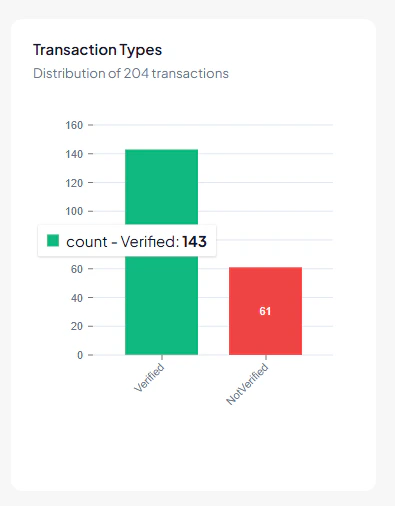
Review Transaction Insights
Transaction Summary (Bar Visualization)
Displays the total number of transactions performed by client users. Bars represent:- Verified transactions
- Non-verified transactions
Recent Transactions
Displays the latest transaction records, such as:- AnalyzeIDCard
- AnalyzePassport

Audit Summary
Displays recent audit events, including:- Configuration updates
- Login activities
- Configuration changes
- Successful logins

3. Navigating the Dashboard
Navigation is managed through the left-hand sidebar, providing access to all client modules:- Home
- Status
- User Journey
- User Management
- Customer
- Search
- Event Watch Tower
- SDKs
- Sandbox Users
- License
- Finance & Billing
- Support Tickets